
We will create a database and populate it with UK streets and incidents of street crime. We will then plot the crimes on an interactive map for further analysis.
Preamble
It is assumed that the following packages are installed. This tutorial was run on Debian 7.
- postgresql
- postgis
- qgis
- osmimp
Create a GIS database
We will create a PostgreSQL PostGIS database on the local machine. Eventually all our spatial data will be stored here. This database will be called gisdev.
createuser gisuser
createdb --encoding=UTF8 --owner=gisuser gisdev
psql --username=gisuser --dbname=gisdev --command="\d"

su - postgres
psql --username=postgres --dbname=gisdev --file=/usr/share/postgresql/9.1/contrib/postgis-1.5/postgis.sql
psql --username=postgres --dbname=gisdev --file=/usr/share/postgresql/9.1/contrib/postgis-1.5/spatial_ref_sys.sql
psql --username=postgres --dbname=gisdev --command="ALTER TABLE geometry_columns OWNER TO gisuser"
psql --username=postgres --dbname=gisdev --command="ALTER TABLE spatial_ref_sys OWNER TO gisuser"
psql --username=postgres --dbname=gisdev --command="ALTER TABLE geography_columns OWNER TO gisuser"
exit

psql --username=gisuser --dbname=gisdev --command="\d"
I also needed to add a line near the top of pg_hba.conf.
local gisdev gisuser trust
Load OpenStreetMap data
The OpenStreetMap data is a huge data set so we will download a portion of it.
wget http://download.geofabrik.de/europe/british-isles-latest.osm.pbf
Now this data needs to be loaded into the GIS database. We will use imposm to do this.
imposm --read british-isles-latest.osm.pbf
imposm --write --database gisdev --user gisuser
imposm --optimize --database gisdev --user gisuser
imposm --deploy-production-tables --database gisdev --user gisuser
psql --username=gisuser --dbname=gisdev --command="\d"
Load the police crime data
The UK police crime data is available online to download. We need to download the force boundary KMLs and the relevant crime KML. The file name for the crime data is determined by selecting the required check boxes and clicking on 'Generate file'. You can get the correct download URL under the 'this URL'. link. Below we have chosen Essex May 2013 data.
wget http://data.police.uk/data/kmls/force_kmls.zip
wget https://policeuk-data.s3.amazonaws.com/download/fa4fbc965b805d06d3550e66f5c9db9f6d07508d.zip
Decompress the ZIP files to extract the data.
unzip force_kmls.zip
Archive: force_kmls.zip
[...]
inflating: force kmls/essex.kml

unzip fa4fbc965b805d06d3550e66f5c9db9f6d07508d.zip
Archive:  fa4fbc965b805d06d3550e66f5c9db9f6d07508d.zip
  inflating: 2013-05/2013-05-essex-street.csv
  inflating: 2013-05/2013-05-essex-outcomes.csv
To load the data into the GIS database, we first need to convert it into a suitable format for shp2pgsql to load. Start QGIS and load each layer (as documented below). For each layer choose the 'Layer' and 'Save As...' menu items. Choose 'ESRI Shapefile' and pick a file name to save.
However, note that OSM data and the KML and CSV data use different projections. If all layers are loaded together then they will not be plotted together correctly. Enabling 'on the fly' reprojection by default remedies this. The setting can be found in QGIS under menus 'Edit' then 'Options...', then the 'CRS' tab.
To load a KML file into QGIS, choose the menu items 'Layer' and 'Add Vector Layer...'. Next click 'Browse' and choose the downloaded KML file. For example, we want force kmls/essex.kml for our example. Now click 'Open'.
To load a CSV file into QGIS we must first enable a plug-in. Go to the 'Plugins' and 'Manage Plugins...' menu. Tick the 'Add Delimited Text Layer' plug-in and click 'OK'. Choose the menu items 'Layer' and 'Add Delimited Text Layer'. Next click 'Browse' and choose the downloaded CSV file. For example, we want 2013-05/2013-05-essex-street.csv for our example. Under 'Selected delimiters', ensure only 'Comma' is checked. Now click 'OK. The Coordinate Reference System (CRS) for the data is WGS84 according to the online information, so leave this set to 'WGS 84, authority EPSG:4326'.
Now the data can be loaded into the GIS database.
psql -c "SELECT PostGIS_Version()" -U gisuser gisdev
shp2pgsql -I -s 4326 essex.shp police_forces | psql -U gisuser gisdev
psql -c "update police_forces set name='Essex Police' where name is null;" -U gisuser gisdev
shp2pgsql -I -s 4326 2013-05-essex-street.shp street_crimes | psql -U gisuser gisdev
Bringing it all together
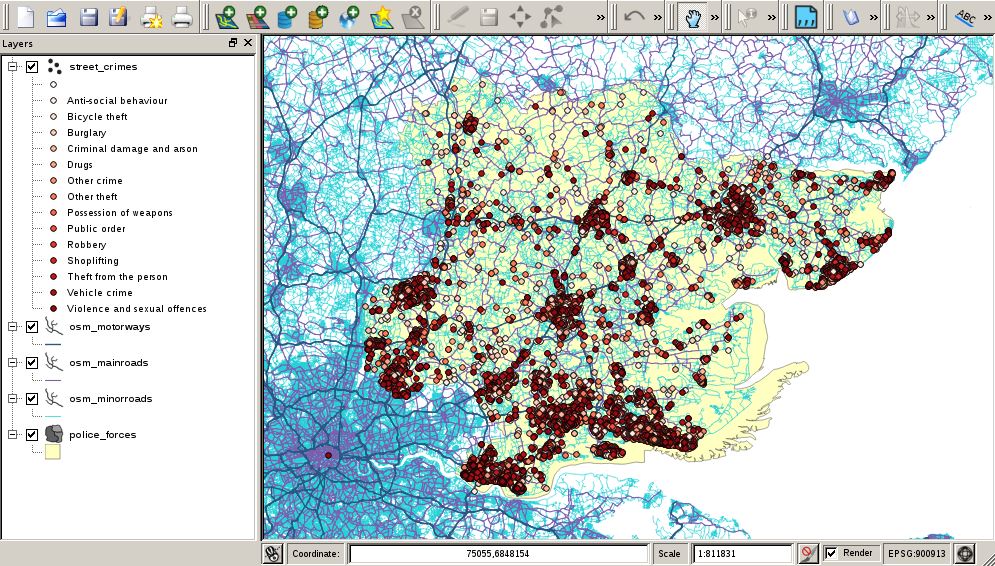
Now we have a single GIS database with all the mapping and crime data we need. Run QGIS again. Add the required layers using 'Layer' and 'Add PostGIS Layer...' menus. We require the following layers, ordered in the navigation pane as follows. I added them from the bottom, up.
- street_crimes
- osm_motorways
- osm_mainroads
- osm_minorroads
- police_forces
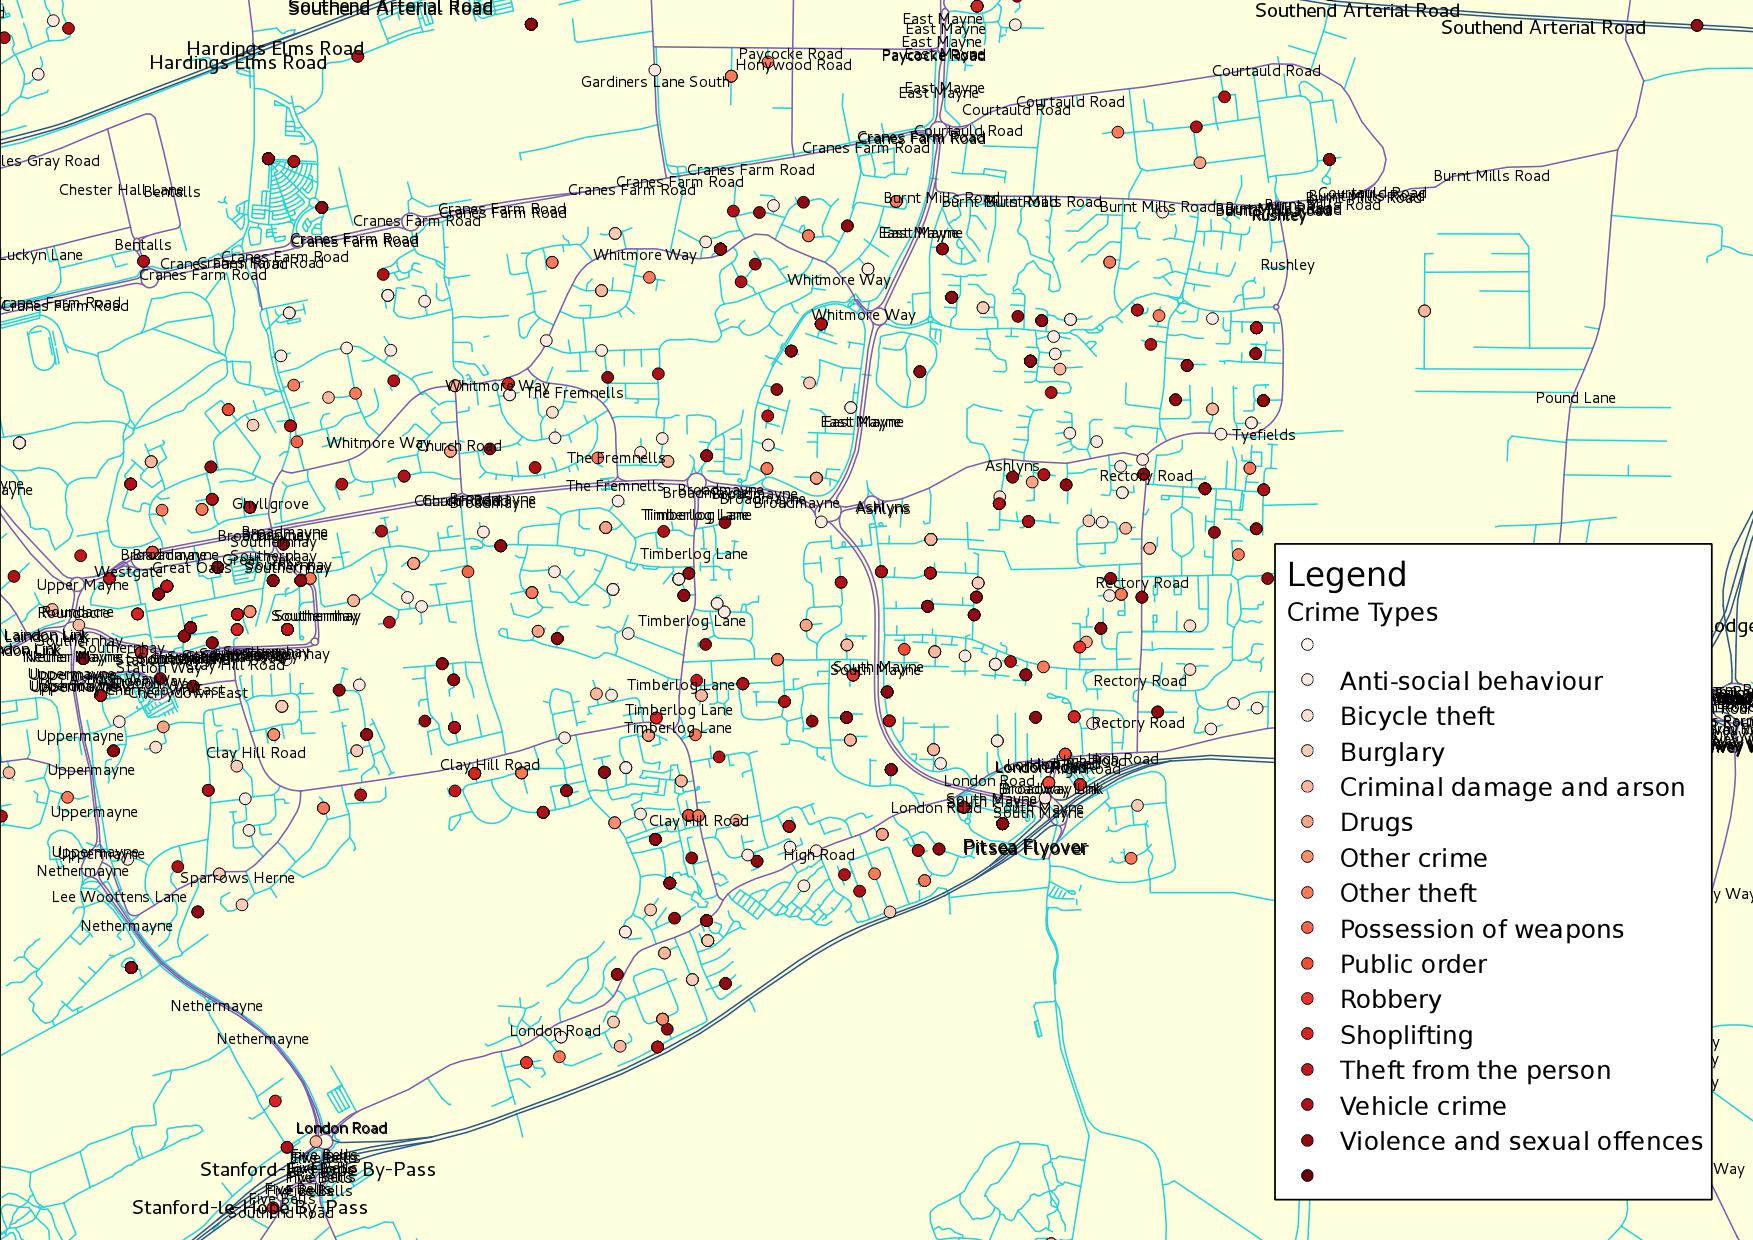
Choose the colour blue for the road layers. Choose a progressively darker colour for the more 'important' road layers. A pale orange colour is good for the police_forces layer. Different types of crime can be plotted with a different colour dot. Double-click the street_crimes layer and choose the 'Style' tab. Change the drop-down from 'Single Symbol' to 'Categorized'. Change the column to 'crime type'. Choose appropriate symbols and colours, then click 'Classify' and 'OK'.
Incidents of crime can also be labelled. Double-click the street_crimes layer and choose the 'Labels' tab. Check the 'Display labels' check box. Change 'Field containing label' to 'crime type', then choose a font size and colour and click 'OK'.
| Attachment | Size |
|---|---|
| QGIS GUI showing Essex street crimes (199.27 KB) | 199.27 KB |
| Local crime map of Basildon, Essex (PDF) (215.44 KB) | 215.44 KB |
| Local crime map of Basildon, Essex (JPEG) (408.6 KB) | 408.6 KB |
Update and improvements
Just some late updates to this article. I now use a process to upload the data to the GIS database without using the GUI. This simplifies the process considerably and supports automation. The process goes along the lines of this.
Unzip the crime data CSV files into a temporary directory named, say, tmpcsv.
Create a file named street-conv.vrt with the following content.
<OGRVRTDataSource>
    <OGRVRTLayer name="street-wip">
        <SrcDataSource>street-wip.dbf</SrcDataSource>
        <Field name="Crime ID" type="String" width="80" />
        <Field name="Month" type="String" width="80" />
        <Field name="Reported by" type="String" width="80" />
        <Field name="Falls within" type="String" width="80" />
        <Field name="Longitude" type="Real" width="24" precision="15" />
        <Field name="Latitude" type="Real" width="24" precision="15" />
        <Field name="Location" type="String" width="80" />
        <Field name="LSOA code" type="String" width="80" />
        <Field name="LSOA name" type="String" width="80" />
        <Field name="Crime type" type="String" width="80" />
        <Field name="Last outcome category" type="String" width="80" />
        <Field name="Context" type="Integer" width="10" />
        <GeometryType>wkbPoint</GeometryType>
        <LayerSRS>WGS84</LayerSRS>
        <GeometryField encoding="PointFromColumns" x="Longitude" y="Latitude" />
    </OGRVRTLayer>
</OGRVRTDataSource>
Now run a script such as the following to combine all the different months of data, add the point geometry, and upload the data into the GIS database.
D1=`ls -1 tmpcsv | head -1` # Earliest yyyy-mm.
D2=`ls -1 tmpcsv | tail -1` # Latest yyyy-mm.
SHP=${D1}-${D2}-essex-street.dbf

for CSV in tmpcsv/????-??/????-??-essex-street.csv; do
  ogr2ogr -f "ESRI Shapefile" -a_srs EPSG:4326 -append street-wip.dbf $CSV
done

rm -R tmpcsv

ogr2ogr -f "ESRI Shapefile" -a_srs EPSG:4326 -overwrite $SHP street-conv.vrt

shp2pgsql -a -I -s 4326 -g the_geom $SHP street_crimes | psql -U gisuser gisdev

rm street-wip.prj street-wip.dbf
I derived the above process improvements from here and here.