
Oracle Grid Control or Cloud Control. Also known as Oracle Enterprise Manager (OEM).
Capacity trending graphs/charts in Oracle Grid Control
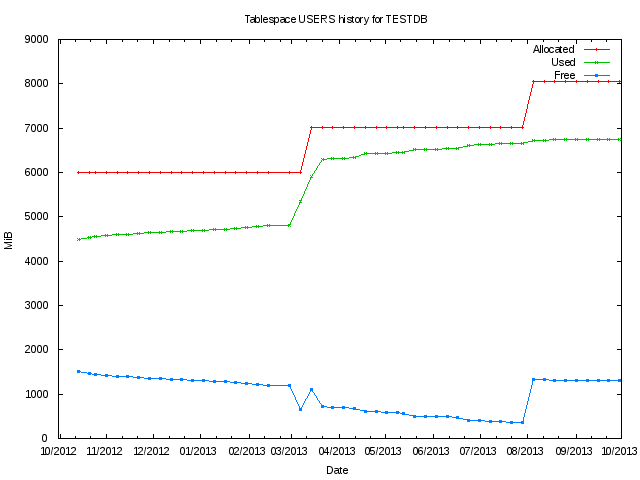
Below I will annotate an example using SQL to extract and chart some tablespace trending data using GNU Plot.
Oracle's Grid Control collects, stores, and manages historical metric data for hosts, databases, and all sorts of targets. This data is difficult to retrieve, especially the historical data. Creating a report in Grid Control results in a small bitmapped image. If you need, say, a year of CPU data, this small bitmap is difficult to interpret.
If the data is extracted from Grid Control's Oracle Management Service (OMS) then graphically representing the data can also be performed externally. One such tool that can be used to graph the data is GNU Plot.